Common Network Troubleshooting Use Cases: Traceroute

In the realm of network troubleshooting, mastering various tools is indispensable. Today, we're focusing on an essential command: traceroute. This tool offers a unique perspective by providing detailed route analysis, helping you efficiently identify and troubleshoot network issues. Regardless of your experience level, understanding the capabilities of traceroute is key to unraveling the complexities of network diagnostics.
Let's explore how it can support you with troubleshooting network issues and how you can use it with Globalping to take measurements worldwide.
Common Issues Addressed by Traceroute
If you’re new to traceroute, check out our blog post to learn how to use traceroute and how to read its results!
Identifying Network Hops
One everyday use case for traceroute is identifying the network hops between your device and a destination host. Each hop represents an intermediate point through which your data travels. This information is valuable for pinpointing where connectivity issues may arise. Here's an example of a traceroute result:
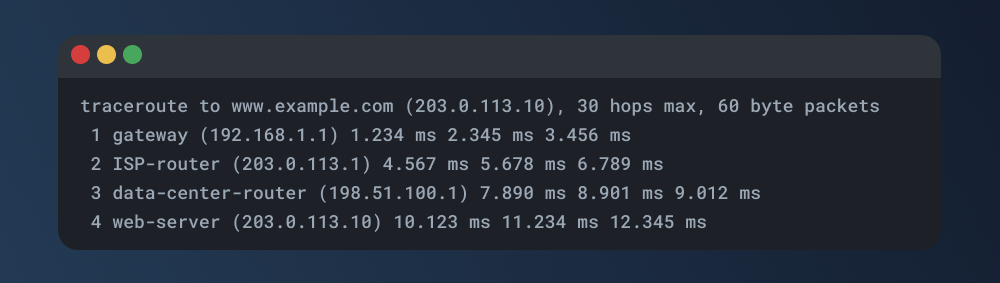
In this example, the traceroute command illustrates the path taken from the initiating device to the web server. Each hop is distinctly presented, accompanied by its corresponding IP address and response time. This straightforward representation facilitates a clear understanding of the network's architecture and serves as a foundation for troubleshooting. You can discern potential problematic points by dissecting these hops, helping you pinpoint issues and optimize your network for optimal performance.
Detecting Packet Loss at Specific Hops
Traceroute can also help identify packet loss at specific hops along the route. If a particular router or node is causing packet loss, it could indicate a network problem. Here's an example:
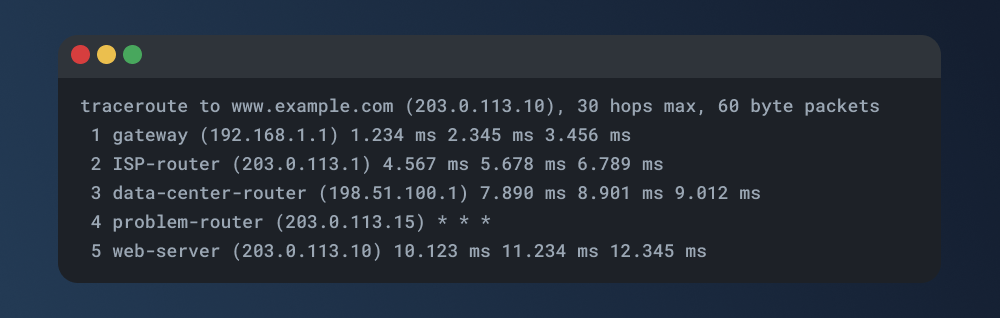
In this scenario, the asterisks (*) alongside the 'problem-router' signify packet loss at that specific hop. Traceroute helps us play detective by showing exactly where these losses are happening. When we find the spot, we can focus on fixing it, ensuring our data gets to its destination without any disappearances. It's like making sure our messengers reach their target safely!
Identifying High Latency Points
Traceroute is not just a map for your data's journey; it's also a timekeeper, helping us spot places where our data might take too long to reach its destination. We call this "latency," and identifying high latency points is crucial for ensuring a smooth and speedy data transfer.
Let's take a look at this example traceroute result:
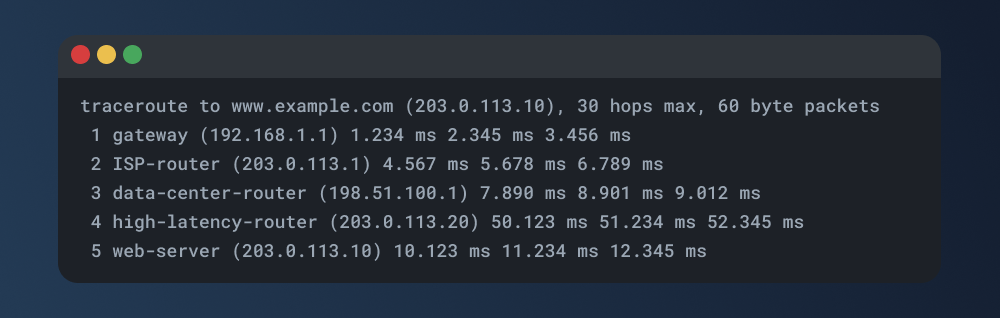
The 'high-latency-router' is our culprit, causing potential delays with response times like 50.123 ms. Traceroute spots these slow areas, allowing us to address them. Fixing high-latency points is like smoothing out a bumpy road – it ensures a faster and more efficient data journey for a smoother online experience.
Introducing Globalping for Traceroute
Now that we've explored traceroute's troubleshooting capabilities, let's introduce how Globalping takes this functionality to the next level.
Globalping is a network testing platform for monitoring, debugging, and benchmarking your internet infrastructure from a globally distributed probe network. Anybody can use Globalping for free to perform crucial tests such as ping, traceroute, mtr, and dig effortlessly.
Why Use Globalping for Troubleshooting?
Let's explore some advantages of running traceroute with Globalping:
-
Global Insights: Globalping lets you perform traceroute tests from multiple spots worldwide simultaneously. This means you get a global view of your network, making it easier to pinpoint issues accurately.
-
Boost Efficiency: Streamline troubleshooting by identifying problematic hops, packet losses, or latency points from different locations across the globe.
-
In-depth Understanding: Gain comprehensive insights into your network's performance. Test routes from diverse locations, identify bottlenecks and optimize your network for a smoother user experience.
How to Use Traceroute with Globalping
Let's dive into Globalping's capabilities with an example using the Globalping CLI tool. If you're not yet on board, check out the installation guide here or explore other official integrations on the same page.
Let's say we want to trace the route to a website from two distinct locations: Tokyo and North America. Open your terminal, input, and execute the following command:
globalping traceroute jsdelivr.com from Tokyo,North America --limit 2
Feel free to swap out the domain and locations based on your use case. The `--limit` flag lets us specify the number of desired results, defaulting to one (1).
Here's our result:
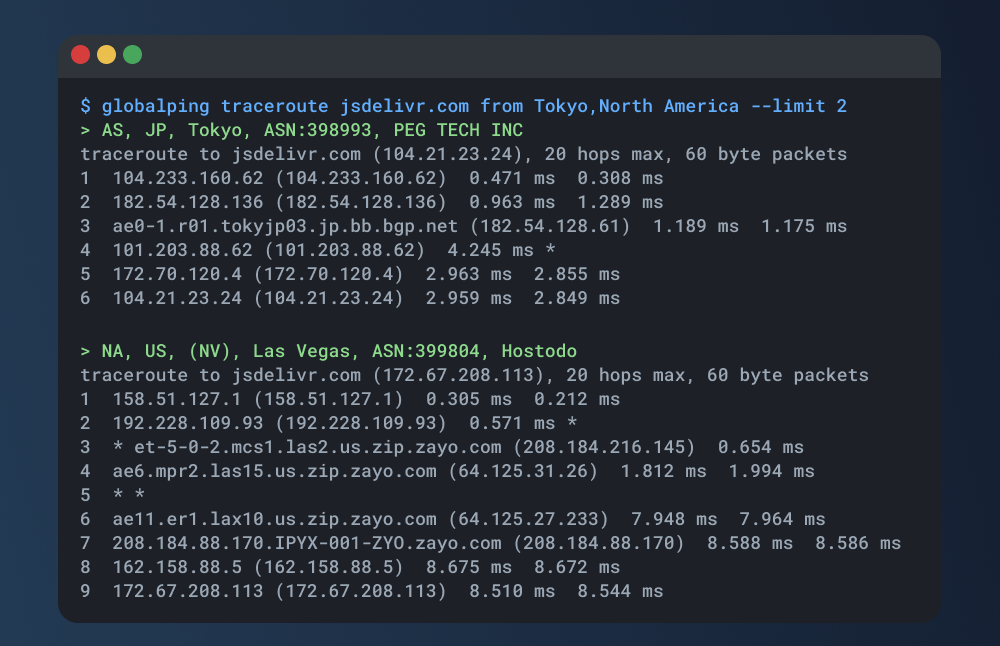
As you can see, we have traced the route from a probe in Tokyo and a probe in North America to the specified destination, resulting in two sets of results. Also, note that the structure is the same as you are familiar with when using the traditional traceroute command on Linux-based systems!
Explore our GitHub repository for a deeper dive into the platform and how to make the most of it.
Conclusion
And there you have it – the power of traceroute at your fingertips. From unraveling the path of your data to identifying hiccups along the way, it's a tool every network troubleshooter should have in their kit.
With Globalping, we're taking traceroute to new heights: Run simultaneous tests from different corners of the globe, making troubleshooting more efficient and helping you gain a comprehensive understanding of your network's performance. Why not give Globalping a try and see for yourself?
Happy testing!