How to Read MTR Results: A Beginner’s Guide

MTR, short for "My TraceRoute," is a powerful network diagnostic tool that combines the features of both ping and traceroute. It offers a detailed view of network performance by continuously probing the route between your computer and a target device.
In this article, we will explore how to run an MTR command, read and interpret the results, and leverage mtr from any location with Globalping.
What is MTR?
MTR is a network utility that provides real-time insights into the path your data takes to reach its destination. Unlike traditional traceroute, which displays a static snapshot of the route, MTR constantly monitors the network, providing dynamic statistics about each hop. This dynamic nature makes it exceptionally valuable for identifying network issues and pinpointing performance bottlenecks.
Running MTR
Executing an MTR command is similar to running a traceroute or ping command. The basic syntax is as follows:
mtr [options] target
target: This is the hostname or IP address of the device or server you want to probe.options: You can use optional parameters to customize your MTR command, such as setting the report interval or specifying the maximum number of packets to send.
Note: If you're on Windows, you need to download and install an application such as WinMTR, which comes with a graphical interface. However, if you know how to run MTR on Linux-based systems, you can also read the results with WinMTR.
Example: Running an MTR to google.com
Let's say you want to run an MTR to Google's website. You can initiate the MTR process by executing the following command:
mtr google.com
This command starts MTR and provides dynamic statistics about the route to Google.
Understanding MTR Results
MTR results may appear complex at first glance, but breaking down the information makes it more approachable. MTR generates a continuously updating table that can look something like this:
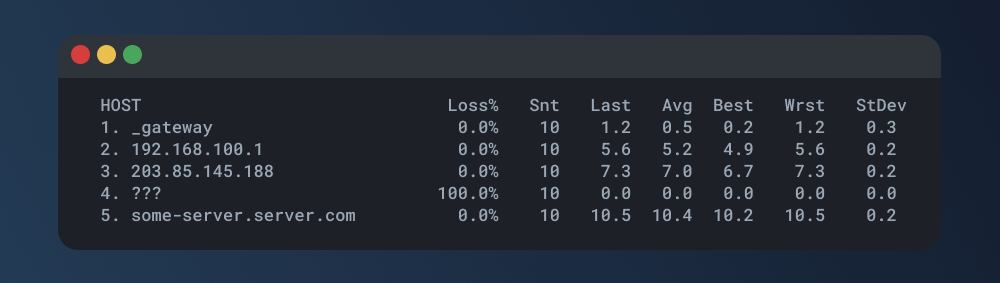
Let's see what we can learn from the result:
1. Host: IP address or hostname of a hop.
2. Loss%: indicates the percentage of packets lost at each hop. It's a critical measure of network reliability. Lower loss percentages are preferable.
3. Snt: "Snt" stands for "Sent," displaying the number of packets sent to each hop.
4. Last: represents the last recorded round-trip time (RTT) to the hop.
5. Avg: the average RTT for packets sent to that hop.
6. Best: shows the best (lowest) RTT recorded for that hop.
7. Wrst: represents the worst (highest) RTT recorded for that hop.
8. StDev: is the standard deviation, indicating the variance in RTT values.
By analyzing these components of the MTR result, you can assess network reliability, identify delays or packet loss, and pinpoint potential trouble spots in the network.
Note: Use the option -o to define the list of fields and their order that you want to retrieve. For example, -o "LSD AW X" will display loss ratio, sent packets, dropped packets, average RTT, worst RTT, and worst jitter. Type mtr man in your terminal to learn more about the available options.
Using MTR with Globalping: Gain Global Insights
Just as we introduced you to Globalping for running ping and traceroute tests, our platform also lets you run MTR commands, offering you the ability to monitor network performance from virtually any location globally for free.
How to Use Globalping for MTR
1. Install the CLI Tool: To start, visit our GitHub page and follow the step-by-step instructions to set up the Globalping CLI tool on your machine.
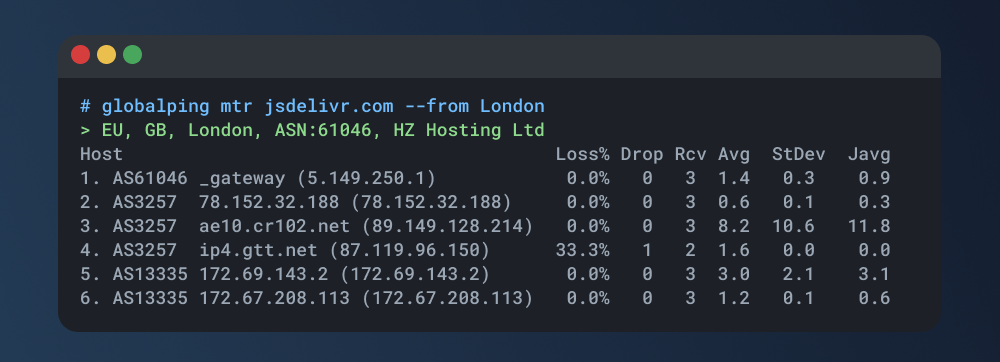
2. Run your first MTR: Once the CLI tool is successfully installed, you're ready to run your first MTR command. Open your terminal and execute the following to initiate an MTR from a specific location, such as London:
globalping mtr jsdelivr.com --from London
In this command:
- Replace "jsdelivr.com" with the domain or IP address you want to monitor.
- Modify the location ("London" in this case) to specify the starting point of the MTR.
The result you receive will closely resemble the familiar traceroute output we explored earlier in this article. Some of the fields are different from the standard MTR results and are customized to provide the most useful data right off the bat for most use cases.
Run globalping mtr --help to learn more about all the options you can use with the command and how to customize it. Alternatively, you can also check out our documentation to learn more.
Using MTR Effectively
Finally, here are some tips for using MTR effectively:
1. Identify Packet Loss: Pay close attention to the "Loss%" column at each hop. If you notice packet loss, investigate further to determine the source of the issue.
2. Check for Consistency: Look for hops with stable and consistent RTT values, which indicate a healthy network segment.
3. Evaluate Variance: The "StDev" column provides insights into RTT variance. Smaller standard deviation values suggest more predictable network performance.
4. Adjust Reporting: You can customize MTR to report specific parameters or display the output at different intervals. Experiment with these settings to gather the information you need.
5. Use It for Diagnosis: MTR is a valuable diagnostic tool for identifying network problems and tracking their progression over time. It's especially useful when you need continuous monitoring.
Conclusion
MTR is a potent tool for network professionals and enthusiasts, enabling in-depth network performance analysis. Armed with the knowledge of how to run an MTR command and interpret the results, you'll be well-equipped to monitor, diagnose, and optimize network connections effectively.
If you want to expand MTR's capabilities, use Globalping to explore networks from almost any global location. Why not give Globalping a try and see for yourself?