Understanding Network Latency: A Guide for Beginners

Are you new to the world of network testing? If the term "network latency" seems like a puzzle, fear not – we're here to untangle it for you. This blog post is your guide to understanding network latency, how to measure and improve it, and how to use Globalping to measure latency on a global scale.
What is Network Latency?
Network latency is the delay between sending and receiving data over a network. It's like the lag you experience in a video call – that tiny delay between speaking and your friend hearing your words. In networking, latency is measured in milliseconds (ms), and lower values are generally better.
How to Measure Network Latency
In the upcoming section, we'll delve into useful commands for measuring network latency. Keep in mind that these commands might not be pre-installed on your Linux or macOS machine. For Windows users, be aware that command names and outputs may vary.
Ping
Ping is a fundamental tool for measuring network latency. It works by sending a small packet of data to a target server and measuring the time it takes for the packet to make the round trip. The command is straightforward:
ping google.com
Look for the "Round-Trip Time" or "RTT" values in the results. These values represent the time the data travels from your computer to the target server and back. Lower RTT values indicate better network responsiveness.
Example Result:
64 bytes from 93.184.216.34: icmp\_seq=1 ttl=56 time=14.2 ms
64 bytes from 93.184.216.34: icmp\_seq=2 ttl=56 time=13.8 ms
64 bytes from 93.184.216.34: icmp\_seq=3 ttl=56 time=15.0 ms
Learn more about ping and how to read its results.
Traceroute
Traceroute visualizes the path your data takes to reach its destination. It displays the latency at each hop along the way, helping you identify potential bottlenecks. Execute the following command:
traceroute google.com
Look for the time values in each hop. If you see sudden spikes, it could indicate network congestion or a problematic router.
Example Result:
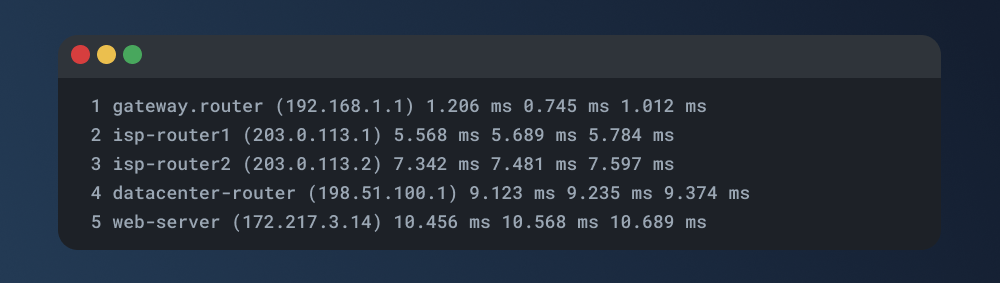
Learn more about traceroute and how to read its results.
Dig
Dig is useful for examining DNS query times. While it may not directly measure network latency, slow DNS resolution can contribute to overall delays. Use the following command:
dig google.com
Look for the "Query time" field, which indicates the time the DNS query takes to resolve.
Example Result:
;; Query time: 20 msec
;; SERVER: 8.8.8.8#53(8.8.8.8)
Learn more about dig and how to read its results.
MTR
MTR combines the functionality of Ping and Traceroute in a single command, offering a more dynamic and real-time view of network performance. To use MTR, simply run:
mtr google.com
MTR continuously updates the information, showing the packet loss and latency at each hop in the network. This live updating feature makes it easier to identify intermittent issues or changes in network performance over time.
Example result:
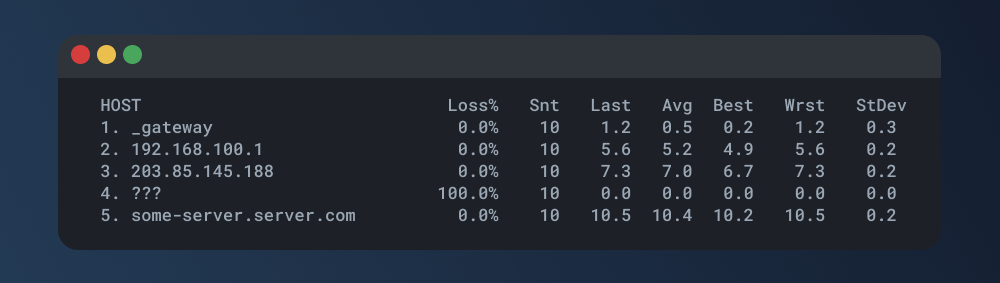
Learn more about mtr and how to read its results.
Interpreting Results
As you analyze the results, focus on consistency and any irregularities in latency values. Low and stable values are generally desired. If you notice sudden spikes or prolonged delays, it's worth investigating further to identify and address potential network issues. Regularly performing these tests and monitoring the results over time will help you maintain a healthy and responsive network.
Improving Network Latency
Now that you understand how to measure latency, let's explore some ways to improve it:
Optimize Your Network
Ensure that your network infrastructure is optimized for performance. This includes using quality networking equipment, optimizing router settings, and maintaining a reliable internet connection.
Choose the Right Service Provider
Different internet service providers (ISPs) offer varying levels of service. Research and choose a provider with a reputation for low latency and high reliability.
Content Delivery Network (CDN)
Consider using a Content Delivery Network. CDNs distribute content across multiple servers globally, reducing the physical distance data travels and, consequently, lowering latency.
Introducing Globalping
Now that you've got a handle on measuring network latency let's explore how Globalping takes your testing capabilities to the next level by allowing you to test globally.
What is Globalping?
Globalping is a network testing platform that lets you run tests from anywhere worldwide. Whether you're a seasoned professional or a curious newcomer, Globalping empowers you to perform crucial tests such as ping, traceroute, mtr, and dig effortlessly.
How Does Globalping Work?
Globalping relies on a network of distributed probes strategically located around the world. This means you can run tests from different geographic locations, providing a comprehensive view of your network's performance. Here's why this global testing capability is a game-changer:
-
Identifying Regional Latency Issues: Network latency is affected by physical distance. You can pinpoint regions with higher latency by running tests from various locations. This information is invaluable for businesses with a global user base, helping them optimize their infrastructure for better user experiences worldwide.
-
Replicating User Experiences: Globalping allows you to mimic the experiences of users in different locations. For example, this is crucial for businesses that provide online services or applications. By understanding the latency users' experience in other regions, you can tailor your network optimization strategies for a more inclusive and responsive service.
-
Benchmarking Against Global Standards: Comparing your network's performance against global standards provides context for improvement. Globalping enables you to assess how your network measures up on a global scale, helping you set realistic goals for latency reduction and overall performance enhancement.
Exploring Latency Measurement with Globalping
Let's delve into running network testing commands using Globalping. You can use the Command Line Interface (CLI) tool to get started.
If you haven't installed it yet, check out the CLI installation instructions here or explore one of our other available integrations to follow along.
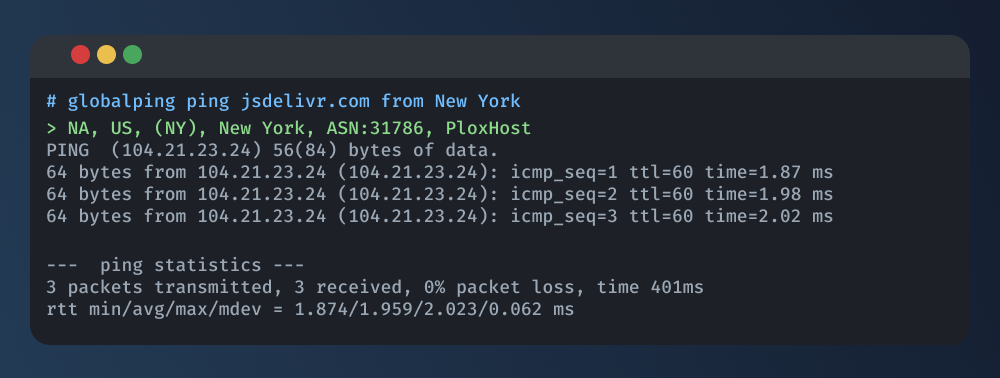
Now, let's craft our first test, focusing on running a ping from a probe located in New York.
In your terminal, type and execute the following command:
globalping ping jsdelivr.com from New York
Swap out the domain and location as needed for your case.
The result structure should look familiar to you (see our tests above!), making it straightforward to analyze:
Moving beyond ping, you can run other tests like mtr, traceroute, and dns (for dig) in a similar way, for example:
globalping traceroute domain.com from Berlin
But wait, there's more! You can enhance your testing experience by exploring features like testing from multiple locations simultaneously, focusing exclusively on data-center-hosted probes, and more. Visit our GitHub repository for additional insights on making the most out of Globalping for your network testing needs!
Conclusion
Congratulations! You've taken the first step into the world of network testing by understanding what network latency is, how to measure it, and even how to improve it.
You've also learned how to level up your testing capabilities with Globalping and how to run the same network tests from anywhere in the world. Give Globalping a try – it's free!
Happy testing!